Epithelial OSMR induction in intestinal inflammation
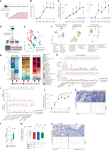
To investigate the cellular components of the OSM–OSMR axis in intestinal inflammation, we used the Helicobacter hepaticus + anti-IL-10R-induced colitis model9,10, which is characterized by prolonged chronic inflammation and microbial dysbiosis, reproducing key pathogenic features of human IBD11. In this model, inflammation becomes evident 3–7 days following initiation, and colitis persists for up to 30 days (Fig. 1a,b). The expression of Osm and Osmr is upregulated early in the course of intestinal inflammation and remains elevated for up to 30 days (Fig. 1c).
a, Schematic of the H. hepaticus + anti-IL-10R-induced colitis time course study. b, Histopathology scores of colitis severity at days 3 (n = 6), 7 (n = 41), 14 (n = 23), 21 (n = 16) and >28 (n = 6), pooled from two to four experiments. Data are shown as mean ± s.e.m. and were analyzed by a Kruskal–Wallis test with a Dunn’s post hoc test. c, qPCR analysis of Osm and Osmr expression in colon tissue at days 3 (Osm/Osmr, n = 4/4), 7 (Osm/Osmr, n = 14/20), 14 (Osm/Osmr, n = 9/14), 21 (Osm/Osmr, n = 20/21) and >28 (Osm/Osmr, n = 10/13), normalized to steady-state controls. Data were pooled from two to four experiments and are shown as mean ± s.e.m. P values were calculated by (two-tailed) one-sample t-tests and Wilcoxon rank tests. d–i, Single-cell workflow: stromal (calcein⁺CD45⁻EpCAM⁻), immune (CD45⁺) and epithelial (EpCAM⁺) cells were sorted, pooled (three mice per pool, three pools per group) and processed with 10x Genomics (18 mice total). d, Experimental approach for single-cell workflow. e, Uniform manifold approximation and projection (UMAP) showing CD45⁺, epithelial and stromal cell clusters. f,g, UMAP (f) and quantification (g) of major cell populations within CD45+, epithelial and stromal clusters; DCs, dendritic cells; LPMCs, lamina propria mononuclear cells; NK, natural killer; Treg, regulatory T cells; TA cells, transit-amplifying cells. h, Relative Osm expression and percentage of Osm⁺ cells within the CD45⁺ cluster. i, Relative Osmr expression and Osmr⁺ cell frequency within epithelial clusters. Data are shown as mean ± s.e.m. and were analyzed by Wilcoxon rank-sum test; NS, not significant. j, qPCR analysis of epithelial Osmr expression at days 3, 7, 14, 21 and >28 (n = 4, 23, 12, 15 and 11, respectively), normalized to steady-state controls and pooled from two to four experiments. Data are shown as mean ± s.e.m. P values were calculated by (two-tailed) one-sample t-tests and Wilcoxon tests. k, ISH of Osmr in colon tissue from colitic (day 10, n = 3) and steady-state mice (n = 6). Purple signal indicates Osmr expression. Data were analyzed by ilastik-based quantification; scale bar, 20 μm. l, Quantification of Osmr⁺ cells by ISH in the lamina propria (pink) and epithelium (green) of colitic (day 7) versus steady-state mice (n = 6). Data were analyzed by Mann–Whitney U-test. m, qPCR of epithelial OSMR expression in healthy individuals and individuals with IBD (UC, n = 10; CD, n = 8). Data are shown as mean ± s.e.m.; statistical tests used were the same as in j. n, ISH of OSMR in mucosal biopsies from healthy individuals (n = 5) and individuals with UC (n = 12); brown dots indicate OSMR⁺ cells. Dashed lines demarcate the epithelium; scale bar, 20 μm.
We next acquired single-cell transcriptomes from distinct cell populations, including colonic epithelial (EpCAM+CD45–), stromal (calcein+CD45–EpCAM–) and CD45+ immune cells (Fig. 1d). Three independent samples were profiled per condition and cell type (Extended Data Fig. 1a,b) to capture all relevant cell populations at steady-state and during peak colitis (day 22; Fig. 1e,f, Supplementary Fig. 1a–c and Supplementary Table 1). Various inflammatory genes were expressed in CD45+, epithelial and stromal cells (Supplementary Fig. 2a). Colitis was characterized by a significant increase in inflammatory monocytes and neutrophils, accompanied by prominent alterations in epithelial and stromal cells (Fig. 1g and Extended Data Fig. 1c).
In healthy mice, Osm expression was detected exclusively in hematopoietic cell types, including neutrophils, monocytes, B cells, ILCs and dendritic cells (Fig. 1h and Extended Data Fig. 1d,e). During colitis, the number of Osm-expressing cells in the colon increased, with inflammatory monocytes, neutrophils and dendritic cells being the primary sources of OSM (Fig. 1h and Extended Data Fig. 1f). Conversely, Osmr was expressed broadly among mesenchymal cell types at steady state (Extended Data Fig. 1g), whereas it was notably absent in immune and epithelial cells (Fig. 1i and Extended Data Fig. 1g,h). By contrast, Osmr expression in colonic epithelial cells was clearly increased during colitis (Fig. 1i and Supplementary Fig. 2b). This expression occurred predominantly in enterocytes (Fig. 1i and Supplementary Fig. 2b). Using quantitative PCR (qPCR), we confirmed that the expression of Osmr was upregulated in intestinal epithelial cells (IECs) as early as day 3 following colitis induction and persisted for at least 28 days (Fig. 1j and Extended Data Fig. 2a–c). Notably, epithelial Osmr expression was upregulated in H. hepaticus + anti-IL-10R-induced colitis but not in the absence of inflammation following H. hepaticus colonization or anti-IL-10R treatment alone (Extended Data Fig. 2c)12,13. The induction of OSMR protein expression in epithelial cells was confirmed by flow cytometry (Extended Data Fig. 2d,e). Exploring putative receptor–ligand interactions in our single-cell RNA-sequencing (scRNA-seq) dataset revealed strong putative interactions between enterocytes and Osm+ immune cells, particularly inflammatory monocytes and neutrophils (Extended Data Fig. 2f). Visualizing Osmr expression in inflamed colonic tissue by in situ hybridization (ISH) confirmed strong Osmr expression in epithelial cells during H. hepaticus + anti-IL-10R-induced colitis and its absence under steady-state conditions (Fig. 1k and Extended Data Fig. 3a,b). Notably, Osmr expression was more prominently upregulated in epithelial cells following colitis induction than in the lamina propria (Fig. 1k,l and Extended Data Fig. 3c–e). Specifically, the upregulation of Osmr expression in epithelial cells correlated significantly with histopathology score, whereas this association was less clear in the lamina propria (Extended Data Fig. 3f,g).
In mucosal samples from individuals with IBD, the expression of both OSM and OSMR is increased7. OSM is primarily enriched in inflammatory monocytes and type 2 dendritic cells, whereas OSMR is most highly expressed by inflammation-associated fibroblasts14, closely resembling the pattern seen in H. hepaticus + anti-IL-10R-induced colitis. Next, we examined the expression of OSMR in epithelial cells in human IBD using publicly available single-cell sequencing data14,15. Remarkably, OSMR was expressed by enterocytes in both individuals with UC (Supplementary Fig. 3a) and individuals with CD (Supplementary Fig. 3b). To validate this finding, we quantified OSMR expression in epithelial cells isolated from colonic mucosal biopsies from healthy individuals and individuals with IBD by using qPCR (n = 10 UC and n = 8 CD) and ISH (n = 10 UC, n = 2 CD and n = 5 healthy individuals). Our analysis revealed significantly elevated epithelial OSMR expression in IBD samples (Fig. 1m,n and Extended Data Fig. 4a,b). Additionally, we confirmed OSMR expression at the protein level and observed that it correlated with histopathology score (Extended Data Fig. 4c).
In summary, although expression of OSMR is primarily confined to mesenchymal cells in healthy intestinal tissue, there is a significant induction of OSMR expression in IECs under inflamed conditions in both mice and humans.
Epithelial OSMR expression drives intestinal inflammation
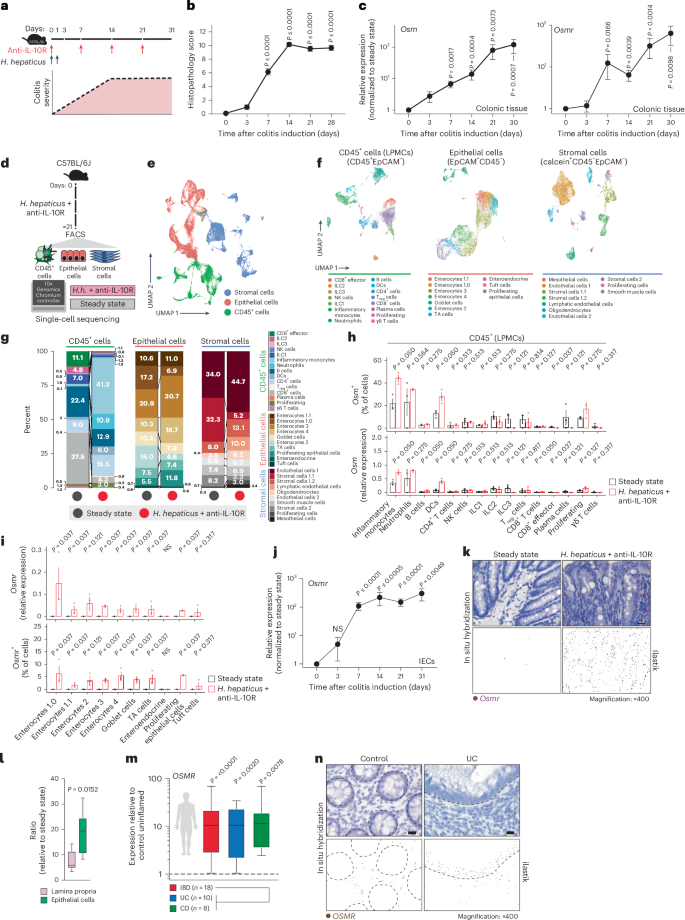
To assess the functional impact of OSMR expression in distinct nonhematopoietic cell types during intestinal inflammation, we implemented conditional deletion strategies by crossing Osmrfl/fl mice with VilcreERT2 (ΙECΔOsmr), Col1a2creERT2 (StromaΔOsmr) and Cdh5cre (EndoΔOsmr) mice to delete Osmr expression in epithelial, stromal and endothelial cells, respectively (Fig. 2a). Cell-type-specific targeting was validated by exploring expression of the deleter genes in our scRNA-seq dataset and by crossing Cre-deleter lines with a fluorescent reporter mouse (Rosa-CAG-LSL-tdTomato (Ai9); Supplementary Fig. 4a,b). OSMR acts as a receptor for IL-31; however, unlike OSM, we did not observe an upregulation of IL-31 in either mouse or human intestinal inflammation (Supplementary Fig. 4c)7. IECΔOsmr and StromaΔOsmr mice were treated with tamoxifen to induce deletion (Fig. 2b), after which colitis was induced in ΙECΔOsmr, StromaΔOsmr and EndoΔOsmr mice using the H. hepaticus + anti-IL-10R approach (Fig. 2b). StromaΔOsmr and EndoΔOsmr mice showed no discernible difference in intestinal pathology compared to controls (Fig. 2c,d). By contrast, histological evidence of colitis and fecal inflammatory markers, such as calprotectin and lipocalin, were significantly reduced in ΙECΔOsmr mice (Fig. 2c–f).
a, Schematic illustrating the Osmr deletion strategy in different cell types. Cell-type-specific deleter mouse lines (VilcreERT2, Cdh5cre and Col1a2creERT2) were crossed with Osmrfl/fl mice to generate the indicated cell-type-specific Osmr knockouts. b, Timeline of tamoxifen administration and subsequent colitis induction. Respective littermate control mice (VilcreERT2–, Cdh5cre– or Col1a2creERT2– crossed with Osmrfl/fl or VilcreERT+, Cdh5cre+ or Col1a2creERT2+ crossed with Osmrfl/wt) were used for each genotype. c, Histopathological scoring 21 days after colitis induction, based on two to three independent experiments (control inflamed, n = 31; IECΔOsmr, n = 13; StromaΔOsmr, n = 21; EndoΔOsmr, n = 12). Adjusted P values calculated from a Kruskal–Wallis test with Dunn’s post hoc comparisons indicate differences between OSMR-deficient and wild-type mice. d, Representative hematoxylin and eosin-stained colon sections from steady-state and inflamed mice of the indicated genotypes at day 21; scale bar, 100 μm. Sample sizes are as indicated in c. e,f, Calprotectin (e) and lipocalin (f) levels in fecal samples from the indicated genotypes, measured by enzyme-linked immunosorbent assay (ELISA) and normalized to their respective inflamed control mice. Data were pooled from two independent experiments (IECΔOsmr, n = 12; StromaΔOsmr, n = 12; EndoΔOsmr, n = 14). P values (two-tailed) were calculated by one-sample t-tests and Wilcoxon tests. g, Differentially expressed genes in colonic tissues (RNA-seq) of the indicated mouse lines compared to either steady-state mice or respective inflamed controls; WT, wild-type. h, Heat map displaying the expression of curated IBD pathway genes in colon tissue of the different mouse genotypes (n = 4–5 per group). i, Top biological processes enriched among differentially expressed genes in colon tissue from IECΔOsmr mice compared to respective inflamed controls (n = 4–5 per group); Padj, adjusted P value.
Using RNA-seq analysis of total colonic tissue, StromaΔOsmr and EndoΔOsmr mice showed an inflamed transcriptional signature compared to steady-state mice but minimal differential gene expression compared to control inflamed mice (Fig. 2g,h, Supplementary Fig. 4d–f and Supplementary Table 2). However, the inflammatory signature was reduced in ΙECΔOsmr mice compared to in wild-type control inflamed mice (Fig. 2g,h, Supplementary Fig. 4g and Supplementary Table 2). KEGG pathway analysis revealed significant alterations in pathways related to cytokine–cytokine receptor interaction, JAK–STAT signaling, IL-17 signaling and IBD pathways (Fig. 2i and Supplementary Table 4).
To confirm the relevance of epithelial Osmr deletion in intestinal inflammation in an independent colitis model, we evaluated OSM and OSMR upregulation in the Citrobacter rodentium infection model. We observed a significant increase in Osm and Osmr expression in colonic tissue following C. rodentium infection (Extended Data Fig. 5a–c). Similarly, Osmr upregulation in epithelial cells was detected as early as day 3 after infection and persisted up to day 21 (Extended Data Fig. 5d,e). Consistent with the H. hepaticus + anti-IL-10R model, C. rodentium infection of IECΔOsmr mice after tamoxifen treatment resulted in reduced histopathology compared to wild-type controls (Extended Data Fig. 5g). Despite this reduction in inflammation, bacterial clearance was unaffected (Extended Data Fig. 5h), indicating that Osmr deletion in epithelial cells mitigates colitis severity without impairing host defence mechanisms.
Overall, these findings reveal a nonredundant pathogenic role for OSM–OSMR signaling in epithelial cells during intestinal inflammation.
Epithelial OSMR expression during colitis requires IL-22
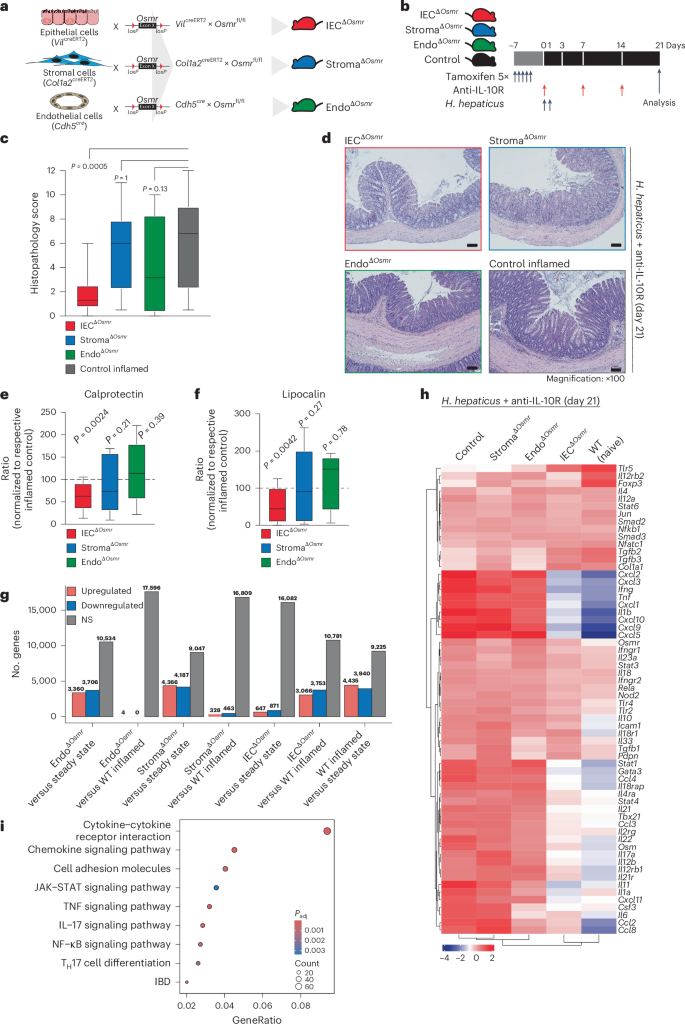
Osmr expression is absent in IECs under healthy conditions but is rapidly induced during colitis (Fig. 1i–k). To identify putative drivers of Osmr expression in IECs, we subjected mouse colon epithelial organoids to various inflammatory stimuli, including cytokines, Toll-like receptor ligands and H. hepaticus bacterial lysates, and analyzed gene expression changes by qPCR (Fig. 3a and Extended Data Fig. 6a). This revealed IL-22 as the most potent inducer of Osmr expression in colon organoids (Fig. 3a). Osmr was induced within 3 h of stimulation with IL-22, suggesting that Osmr is likely a direct target gene of IL-22 signaling (Extended Data Fig. 6b). Consistent with mouse cells, IL-22 also induced OSMR expression in human colon epithelial organoids (Extended Data Fig. 6c).
a, Schematic of colon organoids from female C57BL6/J mice exposed to stimuli for 24 h. Osmr expression was assessed by qPCR (three independent experiments with three biological replicates each); Ct, cycling threshold; IFN, interferon; E. coli, Escherichia coli; LPS, lipopolysaccharide; SCFA, short-chain fatty acid. b, Experimental setup for colitis induction. c, Il22 and Il22ra2 expression in colonic tissues from colitic mice at the following days: day 3 (Il22, n = 8; Il22ra2, n = 9), day 7 (Il22, n = 29; Il22ra2, n = 10), day 14 (Il22, n = 17; Il22ra2, n = 8), day 21 (Il22, n = 14; Il22ra2, n = 11) and >day 28 (Il22, n = 5; Il22ra2, n = 8). Data were pooled from two to five independent experiments and are shown as mean ± s.e.m. P values (two-tailed) were calculated by one-sample t-tests and Wilcoxon rank tests. d, Il22 expression detected by ISH in colon mucosa from steady-state and colitic mice (n = 2); scale bar, 20 μm. e,f, Il22–/– and cohoused wild-type mice analyzed 7 days after colitis induction. qPCR analysis (e; Osmr, Reg3g, Reg3b and Socs3) in epithelial cells (data normalized to steady-state controls; n = 10 per genotype, two experiments) and histopathological scoring (f; n = 10 per genotype, two experiments) are shown; scale bar, 100 μm. g–i, Wild-type mice with H. hepaticus + anti-IL-10R colitis treated with anti-IL-22 (n = 9) or isotype control (n = 15) on days 0 and 3 and analyzed on day 7. g, qPCR of epithelial gene expression. h, Histopathological scoring (two experiments). i, Osmr expression detected by ISH (brown punctae); top, ISH with hematoxylin staining; bottom, ilastik-processed image (n = 3–6 per group); scale bar, 20 μm. j–l, H. hepaticus + anti-IL-10R colitis induced in Vilcre+ × Il22ra1fl/fl or Vilcre– × Il22ra1fl/fl mice, analyzed on day 7 (n = 6 per genotype). j, qPCR for Osmr and Reg3g expression in epithelial cells normalized to steady-state controls. k,l, Histopathological scoring (k) and CD45+ cell abundance (l). m, Wild-type mice with H. hepaticus + anti-IL-10R colitis treated with anti-IL-22 (n = 9) or isotype control (n = 11) on days 7 and 10; data were analyzed on day 14. qPCR was performed on Osmr and Reg3g in epithelial cells (two independent experiments). Data are shown as mean ± s.e.m. P values (two-tailed) were calculated using a Mann–Whitney test for e–h, j, k and m.
IL-22 plays a complex and pleiotropic role in intestinal inflammation, not only exacerbating intestinal inflammation but also promoting epithelial cell survival and regeneration, regulating mucin and antibacterial peptide expression and providing protection in certain colitis models16,17,18. In H. hepaticus + anti-IL-10R-induced colitis, Il22 expression was detected in intestinal tissue as early as day 3 and persisted into the chronic phase of colitis (Fig. 3b,c). Notably, Il22 was predominantly localized near the epithelial barrier in colitis, adjacent to Osmr-expressing IECs, as confirmed by ISH (Fig. 3d and Extended Data Fig. 6d,e). By contrast, IL-22-binding protein (IL-22BP; encoded by Il22ra2), which binds and neutralizes IL-22 (ref. 19), was not induced in H. hepaticus + anti-IL-10R-induced colitis (Fig. 3c).
To evaluate the functional importance of IL-22 in epithelial OSMR expression, we induced colitis in Il22–/– mice (Fig. 3e). Indeed, Il22–/– mice showed reduced intestinal inflammation and failed to upregulate Osmr expression in IECs (Fig. 3e,f). Of note, the intestinal microbiota is altered in Il22–/– mice, potentially impacting colitis development20. To address this potential caveat, we blocked IL-22 using a neutralizing antibody in wild-type mice with H. hepaticus + anti-IL-10R colitis and observed similarly attenuated Osmr expression in IECs, in addition to reduced colitis severity (Fig. 3g–i). Osmr induction required direct IL-22 signaling in IECs, because mice with IEC-restricted IL-22 receptor deficiency (Vilcre+Il22ra1fl/fl)21 also failed to upregulate Osmr in the H. hepaticus + anti-IL-10R model, which correlated with reduced immune cell infiltration in colonic tissue and a concomitant reduction in histopathological features of colitis (Fig. 3j–l and Supplementary Fig. 5a–d). Consistent with the role of IL-22 in upregulating the expression of OSMR on epithelial cells in H. hepaticus + anti-IL-10R colitis, we observed that increased expression of Osmr on IECs in C. rodentium-induced colitis was also IL-22 dependent (Extended Data Fig. 5i,j). This finding confirms the relevance of IL-22 in promoting Osmr expression in IECs across two independent models of intestinal inflammation.
Using a recently identified IL-22-induced gene signature in human IBD tissue22, we investigated whether expression of the IL-22 signature and OSMR are correlated in mucosal samples from individuals with IBD. Indeed, the IL-22 gene signature correlated strongly with OSMR expression across four independent IBD cohorts, comprising more than 868 mucosal samples in total (Extended Data Fig. 6f,g).
To determine whether IL-22 is required to sustain OSMR expression in IECs, colon epithelial organoids were subjected to IL-22 treatment, followed by IL-22 removal and subsequent assessment of Osmr expression. After removing IL-22, Osmr expression significantly decreased (Supplementary Fig. 5e). Similarly, a 7-day regimen of IL-22 blockade in mice with established H. hepaticus + anti-IL-10R colitis caused significantly reduced Osmr expression in IECs (Fig. 3m), demonstrating that IL-22 is required for both induction and maintenance of epithelial OSMR expression during colitis.
IL-22-induced OSMR expression requires STAT3
IL-22 predominantly activates STAT3 and, to a lesser extent, STAT1 (refs. 17,23). Examination of the Eukaryotic Promoter Database revealed predicted binding sites for STAT1 and STAT3 upstream of the Osmr transcription start site. We therefore explored STAT1 and STAT3 phosphorylation in IECs from healthy and colitic mice by western blotting and immunofluorescence and observed clear activation of STAT3, but not STAT1, under inflamed conditions (Fig. 4a–c). By contrast, STAT1 activation was observed mainly in the lamina propria (Extended Data Fig. 7a). As expected, STAT3 phosphorylation in IECs required IL-22 (Fig. 4d,e). Corroborating these results, stimulation of colonic epithelial organoids with IL-22 resulted in clear phosphorylation of STAT3 but not STAT1 (Extended Data Fig. 7b–d).
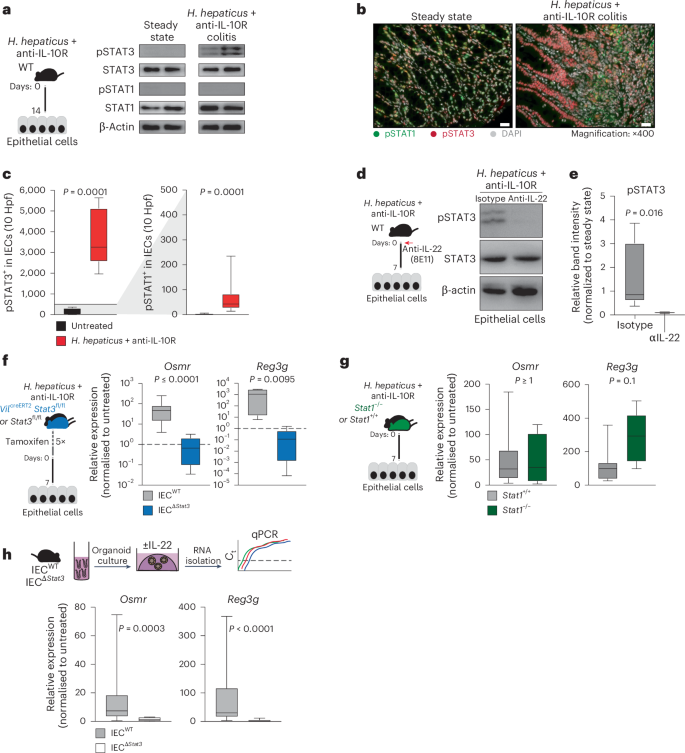
a, H. hepaticus + anti-IL-10R colitis was induced in wild-type mice for 14 days. Protein analysis of IECs from steady-state (n = 4) and H. hepaticus + anti-IL-10R (n = 5) colitic mice was conducted. The western blot depicts phosphorylated STAT1 (pSTAT1), STAT1, pSTAT3, STAT3 and β-actin for representative samples from two experiments. b,c, Immunofluorescence staining for pSTAT1 and pSTAT3 in steady-state (n = 7) and inflamed (n = 10) mouse samples (b) with subsequent quantification (c) in the epithelium; scale bar, 20 μm. Hpf, high-power field. Data were pooled from two experiments. d,e, H. hepaticus + anti-IL-10R colitis was induced in wild-type mice for 7 days, and mice were treated with anti-IL-22 (clone 8e11, n = 4) or isotype control (mouse IgG1, GP120:9709, n = 5) on days 0 and 3 of colitis induction. Protein analysis of IECs from steady-state and H. hepaticus + anti-IL-10R colitic mice and anti-IL-22 or isotype-treated inflamed mice was performed. d, Western blot depicting STAT3 phosphorylation in epithelial cells from anti-IL-22- or isotype-treated colitic mice. Data are representative of two independent experiments. e, Quantification of STAT3 phosphorylation using ImageJ. The relative band intensity of blots from inflamed mice was normalized to that of steady-state untreated mice. f,g, Colitis was induced in VilcreERT2Stat3fl/fl (IECΔStat3) or VilcreERT2Stat3fl/wt (IECWT; f) and Stat1–/– or Stat1+/+ (g) mice using the H. hepaticus + anti-IL-10R model for 7 days. qPCR analysis was performed to assess the expression of Osmr and Reg3g in epithelial cells from inflamed mice normalized to epithelial cells isolated from untreated respective control mice. Data are representative of one experiment; n = 5–7 mice per genotype. h, Mouse colon organoids generated from Vilcre+Stat3fl/fl (IECΔStat3) or Vilcre-Stat3fl/fl (IECWT) mice and stimulated with 10 ng ml–1 IL-22. Relative expression of Osmr was analyzed by qPCR. Data are representative of three independent experiments from three independent biological replicates. P values (two-tailed) were calculated using a Mann–Whitney test for c and e–h.
Source data
To determine the relative contribution of STAT1 and STAT3 to the induction of OSMR expression in IECs, mice deficient in STAT1 or STAT3 were subjected to H. hepaticus + anti-IL-10R-induced colitis. IECs deficient in STAT3 failed to upregulate Osmr expression during colitis, whereas STAT1 deficiency had no discernible impact (Fig. 4f,g). Consistent with these findings, genetic STAT3 deficiency or pharmacologic blockade of JAK1/JAK2 or STAT3 inhibited upregulation of Osmr expression in colonic epithelial organoids treated with IL-22 (Fig. 4h and Extended Data Fig. 7e).
In summary, IL-22 plays a critical role in driving Osmr expression in IECs both in vivo and in vitro, and this process is contingent on STAT3 activation.
ILCs drive early OSMR induction in IECs in acute colitis
IL-22 is expressed predominantly by hematopoietic cells, particularly ILCs and IL-17-producing helper T (TH17) cells17,24,25. To identify the cellular source of IL-22 in H. hepaticus + anti-IL-10R-induced colitis, we evaluated lamina propria T cells and ILCs (live CD45+CD19–CD11c–Ly6G/C–F4/80–FcεRIα–TCRγ– TCRβ–) 7 days after colitis induction using flow cytometry and observed an increased frequency of IL-22+ and proliferating cells (Fig. 5a and Extended Data Fig. 8a,b), consistent with increased absolute numbers of IL-22-producing cells in colitic mice (Fig. 5b). IL-22 production was significantly elevated in ILCs during colitis (Fig. 5c,d and Extended Data Fig. 8c). Specifically, we observed increased abundance of IL-22+ ILC3s after colitis induction (Fig. 5e,f and Extended Data Fig. 8d). IL-22 expression by intestinal ILCs is known to be controlled by the cytokine IL-23, which is comprised of two subunits, IL-12p40 (also shared with IL-12) and IL-23p19 (refs. 17,26,27). We therefore investigated whether inhibition of IL-23 signaling affects OSMR expression in IECs during colitis. Indeed, antibody blockade of either IL-12p40 or IL-23p19 resulted in decreased expression of Osmr and Reg3g in IECs, along with reduced Il22 expression in colon tissue and alleviated intestinal pathology (Fig. 5g and Extended Data Fig. 8e–h). Similarly, IL-23-dependent induction of IL-22 production by ILC3s was observed during colitis in the C. rodentium model (Extended Data Fig. 5k,l).
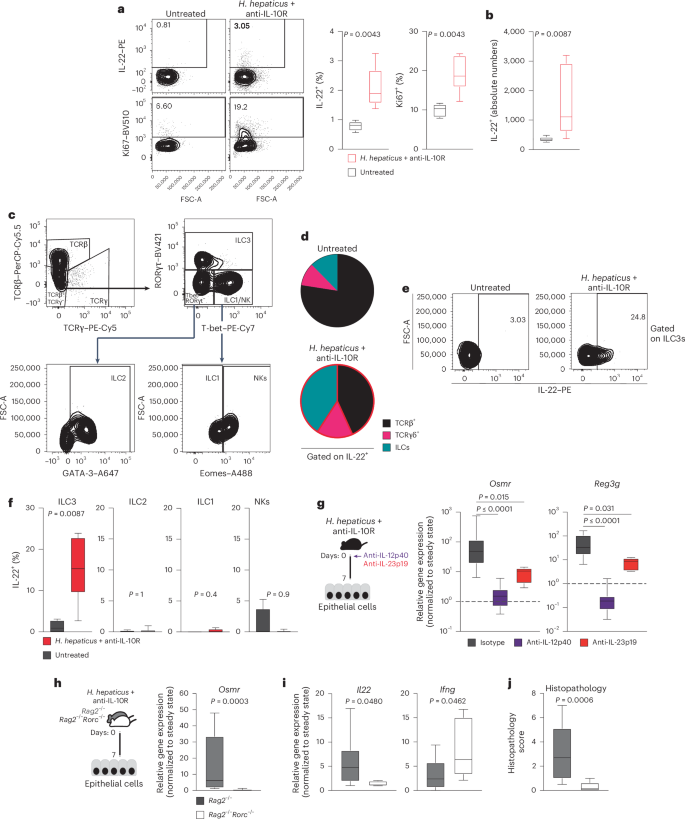
a,b, H. hepaticus + anti-IL-10R colitis was induced in wild-type mice for 7 days. Percentage (a) and absolute cell numbers (b), respectively, of IL-22- or Ki67-expressing CD45+Lin– (that is, live CD45+CD19–CD11c–Ly6G/C–F4/80–FcεRIα–) LPMCs in naive mice and colitic mice were assessed. Flow cytometry-assessed cytokine expression after stimulation with phorbol 12-myristate 13-acetate (PMA)/ionomycin, IL-23 and IL-1β is shown. Data are representative of two experiments; n = 12. c, Representative gating strategy for identifying αβ and γδ T cells and different ILC subsets in colitic mice. ILC subsets were identified by flow cytometry of mouse LPMCs. The ILC population was characterized as CD45+Lin– (that is, CD19–CD11c–Ly6G/C–F4/80–FcERIα–TCRα–TCRγ–) and live cells. Subsets were further defined based on transcription factor expression: ILC3 (RORγt+Lin–TCRα–TCRγ–), ILC2 (GATA3+RORγt–T-bet–Eomes–Lin–TCRα–TCRγ–), ILC1 (T-bet+Eomes–RORγt–Lin–TCRα–TCRγ–) and natural killer cells (T-bet+Eomes+RORγt–Lin–TCRα–TCRγ–). d, Pie chart showing the indicated cell populations within total IL-22+CD45+CD19–CD11c–Ly6G/C–F4/80–FcεRIα– cells in steady-state and inflamed mice on day 7 of colitis. e,f, IL-22 production by different ILC populations identified as described in c. Data are representative of two experiments; n = 12. P values are derived from Mann–Whitney U-tests. g, H. hepaticus + anti-IL-10R colitis was induced in wild-type mice. Mice were treated with anti-IL-12p40, anti-IL-23p19 or isotype control on day 0 and analyzed on day 7. Osmr (left) and Reg3g (right) expression was quantified in epithelial cells by qPCR. Data are representative of one to two independent experiments; n = 6–29 per time point. Adjusted P values were obtained using a Kruskal–Wallis test followed by a Dunn’s multiple comparisons test. h–j, H. hepaticus + anti-IL-10R colitis was induced in Rag2–/–Rorc–/– and Rag2–/– mice for 7 days. h,i, qPCR gene expression analysis of Osmr (h) and Il22 and Ifng (i) in colonic IECs from inflamed Rag2–/–Rorc–/– and Rag2–/– mice normalized to steady-state mice. j, Histopathological scoring of colitis in Rag2–/–Rorc–/– and Rag2–/– mice on day 7 of colitis. Data are from one to two independent experiments; n ≥ 6. P values (two-tailed) were calculated using a Mann–Whitney test in a, b, f and h–j.
To further delineate the contributions of innate immune cells in driving early Osmr expression in IECs, we compared Rag2–/– mice (which lack T and B cells) and wild-type mice in the H. hepaticus + anti-IL-10R model. Colitis severity in Rag2–/– mice was significantly less than that of wild-type mice, consistent with a lack of adaptive immunity (Extended Data Fig. 8i), but Osmr was nevertheless induced in IECs from colitic Rag2–/– mice at levels approaching those of wild-type animals for at least 14 days (Extended Data Fig. 8j). Thus, innate immune cell-derived IL-22 is sufficient to induce sustained Osmr expression in IECs. ILC3 development requires the transcription factor RΟRγt (encoded by Rorc). Therefore, we next evaluated the functional relevance of ILC3 by inducing colitis in Rorc–/–Rag2–/– mice (which lack ILC3) and observed reduced Il22 expression in the colon, reduced epithelial Osmr expression and attenuated colon histopathology compared to Rorc-sufficient Rag2–/– mice (Fig. 5h–j).
These findings highlight the role of innate immune cells in driving IL-22-induced upregulation of OSMR expression in IECs. Additionally, these findings demonstrate that IL-22 can sustain OSMR expression in IECs independently of T cells, thus initiating the IL-22–OSM inflammation circuit.
OSMR in IECs drives STAT3 and leukocyte recruitment
To better characterize the biological impact of OSM on IECs during colitis, we first evaluated our scRNA-seq data from epithelial cells collected at steady-state or at the peak of colitis (day 21). IECs from colitic mice showed upregulation of inflammation-associated genes, such as Ccl8, S100a8, Saa3 and Reg3b, in addition to several inflammatory pathways, including cellular response to lipopolysaccharides, response to type 2 interferons and antigen processing and presentation (Fig. 6a,b and Supplementary Tables 3 and 4). Prediction of potential upstream pathways identified JAK–STAT signaling as a highly probable driver of the colitis-associated transcriptional response in IECs (Fig. 6c), consistent with a potential role for cytokines such as IL-22 and OSM.
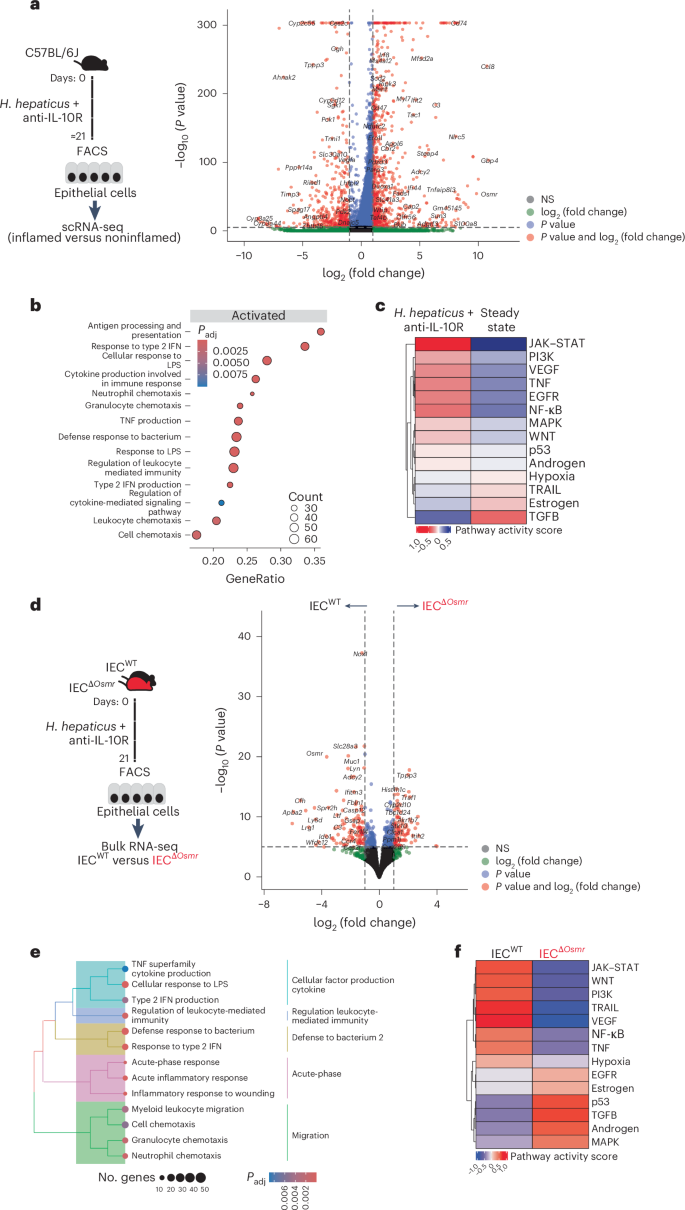
a, Workflow schematic for scRNA-seq sample preparation (left) and volcano plot depicting differentially expressed genes in enterocytes between inflamed mice after colitis induction and steady-state (see Fig. 1d). Red dots represent genes that are expressed at least twofold higher with statistical significance. b, Significantly enriched (adjusted P a; adjusted P values were calculated using the Benjamini–Hochberg test. c, PROGENy pathway activity scores derived from epithelial scRNA-seq data. PROGENy is a computational method that leverages a large compendium of publicly available perturbation experiments to identify a core set of pathway responsive genes, enabling the inference of pathway activity from transcriptomic data. d, Left, experimental workflow of bulk RNA-seq of sorted epithelial cells from IECΔOsmr and control mice. H. hepaticus + anti-IL-10R colitis was induced in IECΔOsmr and control mice (littermates). IECs were sorted from both genotypes on day 21 and subjected to bulk RNA-seq. Right, volcano plot depicting differentially expressed genes in IECs between inflamed IECΔOsmr and control mice (n = 5 per group). Red dots represent genes that are expressed at least twofold higher with statistical significance. e, Significantly enriched (adjusted P d; adjusted P values were calculated using the Benjamini–Hochberg test. f, PROGENy pathway activity scores derived from epithelial bulk RNA-seq data in d.
To precisely delineate the transcriptional alterations in IECs mediated by OSM, we sorted epithelial cells from IECsΔOsmr and control mice after colitis induction and subjected them to RNA-seq analysis (Fig. 6d and Supplementary Table 3). Pathway analysis identified reduced inflammatory gene expression in OSMR-deficient IECs, including response to lipopolysaccharides and type 2 interferons (Fig. 6e and Supplementary Table 4). As expected, JAK–STAT signaling was identified as a key upstream cascade regulating IEC response in control mice but was predicted to have low activity in the absence of OSMR (Fig. 6f). Previous studies have shown that OSM can stimulate STAT3 activation in human epithelial cell lines28. Interestingly, we observed that OSM induced a robust and sustained activation of STAT3 compared to IL-22 in colon epithelial cells (Extended Data Fig. 9a). Furthermore, OSMR-deficient IECs failed to maintain STAT3 phosphorylation following colitis induction (Extended Data Fig. 9b), along with a reduction in the OSM-responsive transcriptional program in these cells (Extended Data Fig. 9c,d and Supplementary Table 6).
We next compared the colitis-associated changes identified in single-cell analysis of wild-type IECs and bulk RNA-seq analyses of OSMR-deficient IECs and identified >1,700 overlapping genes (Fig. 7a and Supplementary Table 4). Pathway analysis of overlapping genes identified strong enrichment of leukocyte migration and chemotaxis pathways (Fig. 7b,c and Supplementary Table 4), suggesting that OSM may act on IECs to modulate leukocyte recruitment during intestinal inflammation. Indeed, flow cytometry analysis of colonic immune cells from IECΔOsmr and control mice following colitis induction revealed reduced infiltration of granulocytes, monocytes and T cells in IECΔOsmr mice compared to respective controls (Fig. 7d). A similar reduction in leukocyte recruitment was observed in IECΔOsmr mice during C. rodentium-induced colitis (Extended Data Fig. 5m).
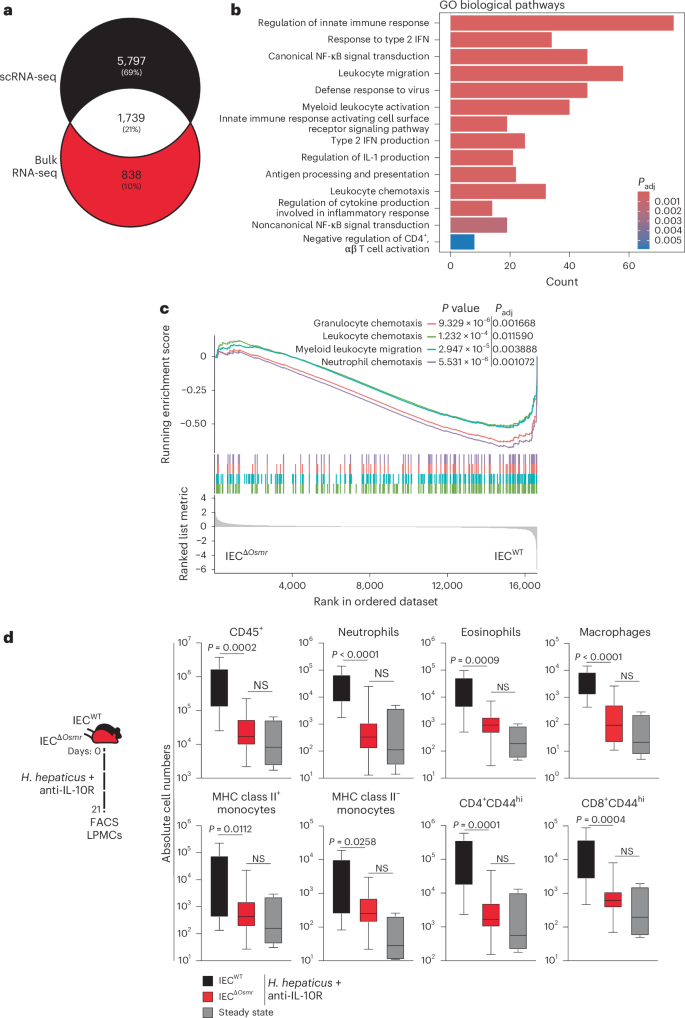
a, Venn diagram representing the overlap of differentially expressed genes in epithelial bulk and scRNA-seq datasets from Fig. 6a,d. b, Significantly enriched (adjusted P 6a,d; adjusted P values were calculated using the Benjamini–Hochberg test. c, GSEA plot depicting the enrichment of differentially expressed genes from pathways related to cell chemotaxis in epithelial cells comparing inflamed IECΔOsmr and control mice, as in Fig. 6d. d, H. hepaticus + anti-IL-10R colitis was induced in IECΔOsmr (n = 13) and control mice (n = 11). The immune cell composition in the lamina propria was analyzed by flow cytometry on day 21 of inflammation. Data are representative of two independent experiments. P values (two-tailed) were calculated using a Mann–Whitney U-test comparing IECΔOsmr and control mice.
Together, OSMR signaling promotes and sustains STAT3 activation and the JAK–STAT transcriptional signature in IECs, thereby promoting intestinal immune cell recruitment during colitis.
Epithelial OSMR is essential for CAC
Chronic mucosal inflammation is a well-established risk factor for CRC, with sustained STAT3 activation being a key driver of its development17,29. Our findings indicate that OSM promotes STAT3 activation and epithelial cell proliferation during colitis (Extended Data Fig. 9b and 10a). Therefore, we investigated the role of OSM in CAC using the dextran sodium sulfate/azoxymethane (DSS/AOM) model, in which epithelial transformation is initiated by administration of the procarcinogen AOM and tumorigenesis is promoted by repeated treatment with the intestinal irritant DSS, causing chronic colitis and consequent tumor growth30,31.
We confirmed increased expression of Osm and Osmr in DSS/AOM-induced colon tumors using a previously published RNA-seq dataset (Extended Data Fig. 10b)32. Osm and Osmr expression in CAC correlated with the expression of Stat3 as well as Socs3, a well-known target gene of STAT3 (Extended Data Fig. 10c,d). We then confirmed that the expression of Osmr was induced in IECs during DSS colitis and in DSS/AOM-induced tumors using qPCR (Extended Data Fig. 10f). Using ISH, we observed strong Osmr expression in tumor epithelial and stromal cells (Pdgfra+; Fig. 8a). However, Osmr was expressed at much lower levels in epithelial cells from adjacent tumor-free and noninflamed tissue (Fig. 8a).
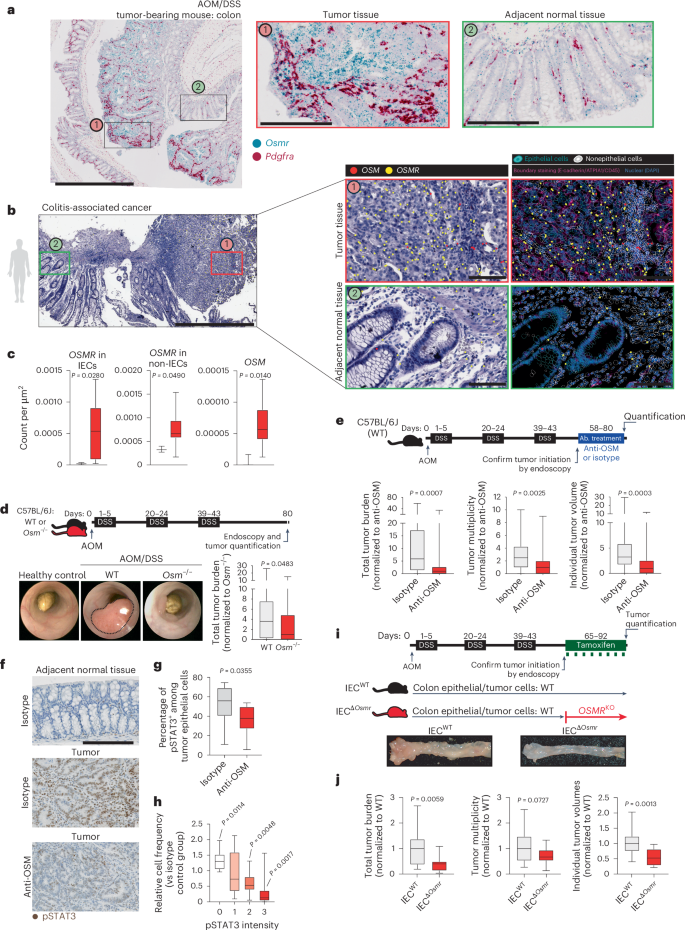
a, Wild-type mice underwent AOM/DSS-induced CAC. Colon tissues from tumor-bearing mice were analyzed by ISH for Osmr (blue) and Pdgfra (red; stromal marker); scale bars, 1,000 μm (left) and 200 μm (two insets on the right). b, Spatial transcriptomics analysis of a biopsy from an individual with CAC, including tumor tissue (red box) and adjacent normal mucosa (green box). OSM and OSMR expression was assessed in epithelial and nonepithelial cells using epithelial (EPCAM, CDH1, KRT20, MUC5B and MKI67) and nonepithelial markers (CD3E, CD4, CD14, CD68, C1QC, CD19, CD79A, PDGFRA, VIM, PECAM1, CD34 and KIT); scale bar, 1,000 μm (left) and 100 μm (insets on the right). c, Quantification of OSMR expression in epithelial and nonepithelial cells in CAC (n = 10, red bars) and healthy control (n = 3, black bars) tissue, along with nonepithelial OSM expression. d, Experimental schematic comparing CAC induction in wild-type versus Osm–/– mice. Representative colonoscopy images and tumor burden on day 80 are shown (n = 25 per genotype). e, Wild-type mice received AOM and DSS, followed by treatment with anti-OSM (n = 28) or isotype antibody (rIgG2a; n = 26). Tumor burden, multiplicity and volume were assessed on day 80. Data are shown normalized to the isotype-treated group. f, Immunostaining for pSTAT3 in colon tumors and adjacent normal tissues from mice treated as in e; scale bar, 200 μm. g, Quantification of pSTAT3+ epithelial cells (n = 10 per group). h, Relative pSTAT3 expression intensity normalized to that observed in control tissue (n = 10 per group). Data are derived from two experiments. P values (two-tailed) were calculated from one-sample t-tests and Wilcoxon rank tests. i,j, VilcreERT2+Osmrfl/fl (IECΔOsmr; n = 15) and VilcreERT2+Osmrwt/wt (IECWT; n = 18) mice were treated with AOM/DSS to induce CAC. Tamoxifen administration induced epithelial-specific Osmr deletion. i, Experimental design and representative colon images. j, Tumor burden, multiplicity and average volumes from two independent experiments. Data are shown normalized to the VilcreERT2+Osmrwt/wt group. P values (two-tailed) were calculated using a Mann–Whitney test in c–e, g and j.
We next investigated the spatial expression and distribution of OSM and OSMR in a cohort of individuals with CAC (n = 10). Consistent with findings in mice, OSMR was highly expressed in tumor epithelial and stromal cells, whereas its expression in epithelial cells was minimal in adjacent tumor-free tissue (Fig. 8b and Extended Data Fig. 10e). Quantitative analysis revealed a significant increase in OSMR expression in tumor epithelial cells compared to in nontumor epithelial cells. Furthermore, OSM expression was elevated in individuals with CAC and remained restricted to nonepithelial cells within the lamina propria (Fig. 8b,c).
To explore the role of OSM in CAC, we next used Osm–/– mice and induced CAC using the DSS/AOM model (Fig. 8d). Interestingly, OSM deficiency significantly reduced tumor burden (Fig. 8d). However, this observation could be due to an impact of OSM on colitis and tumor initiation, an impact of OSM on tumor progression or a combination of the two. To evaluate the impact of OSM on tumor progression, rather than tumor initiation, we induced CAC in wild-type mice and confirmed tumor development by endoscopy, after which mice were treated with anti-OSM or isotype control (Fig. 8e). Anti-OSM treatment reduced tumor size and number, supporting a possible role for OSM in CAC progression (Fig. 8e). Notably, STAT3 phosphorylation was reduced in colonic adenomas after treatment with anti-OSM (Fig. 8f–h).
To address the specific role of OSM in epithelial cells and modulation of tumor progression, we used IECΔOsmr mice to control temporal OSMR expression in IECs in CAC. Tamoxifen was administered after tumor initiation to both IECΔOsmr and control mice, and tumor burden was assessed after 3–4 weeks (Fig. 8i). Remarkably, Osmr deletion in IECs significantly reduced the number and size of tumors, confirming an epithelial-intrinsic role for OSMR signaling in promoting colitis-induced tumorigenesis (Fig. 8i,j).
Osmr upregulation and maintenance in the H. hepaticus + anti-IL-10R colitis model depended on IL-22 and IL-12/IL-23. Notably, DSS treatment also induced epithelial Osmr expression in an IL-22-dependent manner (Extended Data Fig. 10g,h). Next, we evaluated whether IL-12/IL-23 and IL-22 were also required to maintain OSMR expression in established CAC. We observed a correlation between Il12b and Osmr in CAC (Extended Data Fig. 10i). In wild-type mice with established AOM/DSS-induced tumors, blockade of IL-12/IL-23 (using anti-IL-12p40) or IL-22 for 1 week caused reduced expression of Osmr and Socs3 in adenoma epithelial cells (Extended Data Fig. 10j–l). IL-12p40 blockade similarly reduced Il22 expression in adenomas (Extended Data Fig. 10m).
Together, tumor epithelial cells express Osmr in CAC, which promotes STAT3 phosphorylation and tumor growth. Finally, Osmr expression on epithelial cells in CAC is mediated by IL-22.


