Cathepsin L-dependent positive selection shapes clonal composition and functional fitness of CD4+ T cells
CTSL deficiency impairs positive selection of CD4+ T cells
Full genomic deletion of Ctsl in Ctsl−/− mice has pleiotropic effects, most prominently alopecia and epithelial hyperplasia in the skin21, reflecting ‘nonimmune’ functions. To selectively delete Ctsl in TECs, we generated CtslΔTEC mice, which carry a conditional Ctsl allele and a Foxn1-cre transgene (Supplementary Fig. 1a,b). Compared to Ctsl+/+ mice, CtslΔTEC mice showed a reduction in CD4 single-positive (CD4SP) thymocytes, as described in Ctsl−/− mice21 (Fig. 1a,b and Extended Data Fig. 1a). The phenotypic segregation of CD4SP thymocytes into three consecutive maturation stages (CD69+MHCI– semimature, CD69+MHCI+ mature 1 and CD69−MHCI+ mature 2; SM, M1 and M2, respectively)26 was largely preserved, although there was a reduction in the most mature M2 stage (Extended Data Fig. 1b). The proportion of Foxp3+ Treg cells among CD4SP thymocytes was unchanged; however, there was a trend toward an increased proportion of CD73+CCR7− reimmigrants from the periphery (Extended Data Fig. 1c,d). Peripheral CD4+ T cell populations were diminished and contained more ‘memory-like’ Foxp3−CD44+CD62L− cells and Foxp3+ Treg cells (Fig. 1c and Extended Data Fig. 1e–g). CD8+ T cells developed in normal proportions, and the thymic architecture was indistinguishable from Ctsl+/+ mice (Fig. 1a,b and Supplementary Fig. 1e). CtslΔTEC mice did not show skin defects (Supplementary Fig. 1c,d).

a, Representative flow cytometry plots of thymocyte subsets in Ctsl+/+ (n = 8) and CtslΔTEC mice (n = 10); frequency ± s.e.m. of CD4SP thymocytes is indicated. b, Percentages ± s.e.m. of thymocyte subsets as in a; NS, not significant; DN, double negative. c, Representative flow plots of lymph node cells from Ctsl+/+ (n = 3) and CtslΔTEC (n = 3) mice; frequency ± s.e.m. of CD4+ T cells is indicated. d, Representative flow cytometry plots of MHCII expression on CD45−EpCAM+Ly51+ cTECs or CD45−EpCAM+Ly51−CD80+ mature mTECs from Ctsl+/+ and CtslΔTEC mice (n = 20 each) and MHCII−/− mice (n = 3 and 2) as background. e, Representative flow plots and mean fluorescence intensity (MFI) ± s.e.m. relative to Ctsl+/+ cells of MHCII:CLIP on cTECs or mature mTECs from Ctsl+/+ (n = 5) and CtslΔTEC mice (n = 5) and MHCII−/− mice (n = 2) as background. f, Representative flow plots and MFI ± s.e.m. relative to Ctsl+/+ cells of MHCII:non-CLIP on cTECs or mature mTECs from Ctsl+/+ (n = 12) and CtslΔTEC mice (n = 13) and MHCII−/− mice as background. g, Representative flow cytometry plots and MFI ± s.e.m. relative to Ctsl+/+ cells of I-Ab:Eα52–68 on cTECs or mature mTECs from Ctsl+/+ (n = 4) and CtslΔTEC (n = 3) mice on the C57BL/6 × BALB/c F1 background and C57BL/6 (Eα−) mice as background controls. h, CD4SP thymocyte percentages ± s.e.m. in Ctsl+/+ mice (n = 6 or 4) or CtslΔTEC mice (n = 5 or 4) reconstituted with BM from MHCII+/+ or MHCII−/− mice. i, CD4SP thymocyte percentages ± s.e.m. in Ctsl+/+ mice (n = 8 or 9) or CtslΔTEC mice (n = 4 or 3) on a wild-type or Ciitakd transgenic background. j, Representative flow cytometry plots of TCRβ and CD69 surface expression on DP cells from B2m−/−Ctsl+/+ (n = 9) and B2m−/−CtslΔTEC mice (n = 13); frequency ± s.e.m. of TCRβintCD69+ cells is shown (P k, Representative flow cytometry analysis and MFI ± s.e.m. relative to Ctsl+/+ cells of CD5 expression on CD4SP thymocytes from Ctsl+/+ and CtslΔTEC mice (n = 7 each). P values in b were determined by two-way analysis of variance (ANOVA) and Sidak’s test for multiple comparisons and in e–k by Student’s two-tailed t-test.
Source data
Total MHCII on cTECs remained unchanged (Fig. 1d). However, the fraction of pMHCII ligands on CtslΔTEC cTECs that consisted of complexes with the invariant chain-derived peptide CLIP, as detected using the monoclonal antibody (mAb) 15G4, was increased, and, conversely, non-CLIP pMHCII ligands, as indicated by the mAb BP107, were reduced (Fig. 1e,f). Nevertheless, compared to H2-Ab1−/− (hereafter MHCII−/−) cTECs, non-CLIP pMHCII ligands still constituted a major fraction of the pMHCII ligandome in CtslΔTEC cTECs (Fig. 1f). For instance, cTECs from CtslΔTEC C57BL/6 × BALB/c F1 mice presented substantial amounts of the ‘frequent’ non-CLIP ligand I-Ab:Eα52–68, recognized by the mAb Y-Ae, albeit moderately less than Ctsl+/+ control mice (Fig. 1g). These effects were seen in cTECs but not medullary TECs (mTECs; Fig. 1e–g and Extended Data Fig. 1h,i), consistent with the differential expression of CTSL between cTECs and mTECs.
The diminished CD4SP thymocyte population in Ctsl−/− mice has been suggested to result, at least in part, from positive selection of an altered TCR repertoire that is hypersusceptible to negative selection23. To test whether interference with negative selection by hematopoietic APCs ‘rescued’ the CD4SP compartment, we reconstituted Ctsl+/+, CtslΔTEC or Ctsl−/− mice with H2-Ab1+/+ (hereafter MHCII+/+) or MHCII−/− bone marrow (BM). MHCII−/− → Ctsl+/+ chimeras harbored a significantly increased percentage of CD4SP thymocytes compared to MHCII+/+ → Ctsl+/+ controls (Fig. 1h), reflecting diminished negative selection27. By contrast, the CD4SP compartment of MHCII−/− → CtslΔTEC or MHCII−/− → Ctsl−/− chimeras was not, or only marginally, increased compared to the respective MHCII+/+ BM controls (Fig. 1h and Extended Data Fig. 1j). To interfere with negative selection by mTECs, we generated Ctsl+/+, CtslΔTEC and Ctsl−/− mice carrying a transgene (Ciitakd) that mediates tissue-specific knockdown of C2TA, a transcription factor that controls multiple MHCII pathway components, leading to reduced MHCII expression on mTECs28. The Ciitakd transgene resulted in a significantly increased CD4SP compartment in Ctsl+/+ mice28 but did not ‘rescue’ the CD4SP compartment in CtslΔTEC or Ctsl−/− mice (Fig. 1i and Extended Data Fig. 1k).
The proportion of TCRβ+CD69+ cells among CD4+CD8+ (double-positive; DP) thymocytes (representing signal-selection intermediates) was reported to be normal in Ctsl−/− mice23; however, TCRβ+CD69+ DP cells also include CD8+ T cell lineage selection intermediates that engage pMHCI ligands. To exclude these, we generated MHCI-deficient B2m−/−CtslΔTEC mice, which recapitulated the reduced CD4SP compartment associated with CTSL deficiency (Extended Data Fig. 1l). In these mice, where positively selecting interactions could be exclusively attributed to pMHCII ligands, the proportion of ‘signaled’ TCRβ+CD69+ DP cells was reduced to about half that of B2m−/−Ctsl+/+ controls (Fig. 1j). CD5 expression on these DP cells (Extended Data Fig. 1m) and bulk CtslΔTEC CD4SP cells was lower than on their counterparts in Ctsl+/+ mice (Fig. 1k), suggesting that positive selection occurred through relatively weak interactions or nonselection of ‘natural’ CD5hi clones. Together, these findings indicate that the contraction of the CD4+ T cell compartment in CTSL-deficient mice was not secondary to selection of an altered repertoire that was overly susceptible to negative selection but most likely reflected a bona fide numerical constraint in positive selection as a consequence of an altered cTEC pMHCII ligandome.
CTSL deficiency causes ‘clonal holes’ and ‘newcomers’
We next addressed whether the bottleneck in positive selection in CtslΔTEC mice was TCR selective, leading to the disappearance of some clones while allowing others to persist within the repertoire. Across seven transgenic MHCII-restricted TCRs with diverse antigen specificities (OT-II (chicken ovalbumin), Dep (human C-reactive protein), AND and AD10 (pigeon cytochrome c), LLO56 and LLO118 (Listeria monocytogenes listeriolysin O; LLO) and PLP1 (myelin proteolipid protein)), all exhibited a profound blockade in the emergence of CD4SP thymocytes in CtslΔTEC mice, whereas the MHCI-restricted OT-I TCR was efficiently selected (Fig. 2a,b and Extended Data Fig. 2a–e). For each MHCII-restricted TCR transgene, CD5 expression on DP thymocytes, which is upregulated concomitant with positive selection, was substantially reduced in CtslΔTEC mice (Fig. 2c and Extended Data Fig. 2b), suggesting that these TCRs did not, or did not sufficiently, interact with pMHCII ligands to elicit positive selection. When normally selected in Ctsl+/+ mice, OT-II, AND, Dep or AD10 CD4SP thymocytes each displayed distinct CD5 levels, which varied widely between these clones and spanned the entire range of CD5 expression observed in polyclonal CD4SP cells (Fig. 2d). Thus, nonselection in CtslΔTEC mice was not tied to specific CD5 characteristics and, by inference, was not confined to a particular window in the affinity range of positively selecting TCR–pMHC interactions.
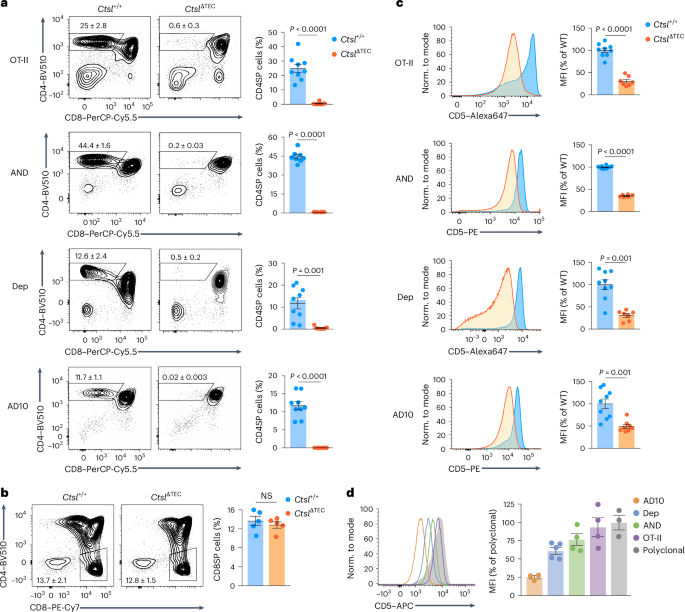
a, Representative flow cytometry plots of thymocyte subsets and percentages ± s.e.m. of CD4SP cells in Ctsl+/+ and CtslΔTEC mice reconstituted with BM from Rag1−/−OT-II (Ctsl+/+, n = 9; CtslΔTEC, n = 7), Rag1−/−AND (Ctsl+/+, n = 8; CtslΔTEC, n = 6), Rag1−/−Dep (Ctsl+/+, n = 9; CtslΔTEC, n = 7) or Rag1−/−AD10 (Ctsl+/+, n = 9; CtslΔTEC, n = 8) TCR transgenic donors. b, Representative flow cytometry plots of the thymus and percentages ± s.e.m. of CD8SP cells in Ctsl+/+ and CtslΔTEC mice reconstituted with BM from OT-I TgRag1−/− donors (n = 5 each). c, Representative flow cytometry plots and MFI ± s.e.m. of CD5 expression in DP thymocytes from BM chimeras as in a, relative to cells selected in Ctsl+/+ chimeras; WT, wild-type. d, Representative flow cytometry plots and MFI ± s.e.m. of CD5 expression in CD4SP thymocytes from Rag1−/−Ctsl+/+ AD10 (n = 3), Rag1−/−Ctsl+/+ Dep (n = 5), Rag1−/−Ctsl+/+ AND (n = 4) and Rag1−/−Ctsl+/+ OT-II (n = 4) TCR transgenic mice relative to polyclonal CD4SP thymocytes (n = 3). P values in a and b were determined by Student’s two-tailed t-test and in c by Welch’s two-tailed t-test.
Source data
To globally characterize TCR repertoire perturbations caused by CTSL deficiency, we crossed CtslΔTEC mice with mice expressing a transgenic TCRβ chain (hereafter TcrbFixed), enabling high-throughput sequencing of variable TCRα chains paired with the ‘fixed’ β-chain. TcrbFixedCtslΔTEC mice had fewer CD4SP thymocytes and peripheral CD4+ T cells (Fig. 3a and Extended Data Fig. 3a–c), with reduced CD5 expression on CD4SP cells (Fig. 3b) compared to TcrbFixedCtsl+/+ mice. Tcra sequencing was performed on CD4SP cells in the most mature M2 stage26, ensuring that the repertoire was fully shaped by thymic selection. Sampling depth approached saturation for both genotypes (Fig. 3c). Repertoire diversity, as assessed using the Shannon index, was significantly lower in TcrbFixedCtslΔTEC mice than in TcrbFixedCtsl+/+ mice (Fig. 3d). Based on the Morisita–Horn index, repertoires were highly stereotypical between genotype-matched replicates but varied significantly between genotypes (Fig. 3e). Of 9,626 ‘recurrent’ TCRs (defined as TCRs found in three or more of all six samples (three TcrbFixedCtslΔTEC and three TcrbFixedCtsl+/+)), 4,765 were shared between the two genotypes (Fig. 3f). Almost half (3,848 of 8,613) of all recurrent TCRs in the TcrbFixedCtsl+/+ repertoire were entirely absent from the TcrbFixedCtslΔTEC repertoire (Fig. 3f), and these ‘CTSL-dependent’ clones disproportionately contributed to the diversity of the ‘normal’ repertoire (Fig. 3g). Conversely, about 20% (1,013 of 5,778) of clones in the TcrbFixedCtslΔTEC repertoire were not found in the ‘normal’ TcrbFixedCtsl+/+ repertoire (Fig. 3f). These ‘newcomer’ TCRs displayed a bias toward more distal TCRα variable (V) and joining (J) elements and increased nucleotide additions or deletions at the V–J joint (Extended Data Fig. 3d–f), suggesting a selection bias for unusual TCR features. Thus, the loss of TCRs in the absence of CTSL was highly selective, affecting roughly half of the ‘normal’ TCR repertoire, whereas a similarly large array of seemingly CTSL-independent TCRs was retained.
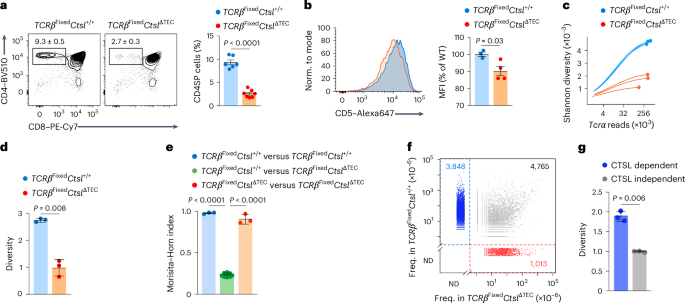
a, Representative flow cytometry of thymocyte subsets and frequency ± s.e.m. of CD4SP thymocytes in TcrbFixedCtsl+/+ (n = 6) and TcrbFixedCtslΔTEC mice (n = 7). b, Representative flow cytometry analysis and MFI ± s.e.m. of CD5 expression on CD4SP cells from TcrbFixedCtsl+/+ (n = 3) and TcrbFixedCtslΔTEC mice (n = 4), relative to TcrbFixedCtsl+/+ samples. c, Analysis of sequencing depth by simulation of Shannon diversity as a function of the number of Tcra reads in bulk TCR-sequencing datasets generated with CD4+CD8α−CD69−MHCI+CD25−FoxP3− M2 CD4SP cells from TcrbFixedCtsl+/+ (n = 3 with cells pooled from two to three mice) and TcrbFixedCtslΔTEC mice (n = 3 with cells pooled from two to three mice). All mice were on a Tcra+/−Foxp3GFP background to exclude dual TCR expression and enable exclusion of Foxp3+ cells. d, Shannon diversity analysis (mean ± s.e.m.) of bulk TCR-sequencing datasets as in c. e, Repertoire similarity comparison by Morisita–Horn index (mean ± s.e.m.) for all pairwise comparisons between TCRα datasets from TcrbFixedCtsl+/+ and TcrbFixedCtslΔTEC mice as in c (n = 3 for TcrbFixedCtsl+/+ versus TcrbFixedCtsl+/+; n = 9 for TcrbFixedCtsl+/+ versus TcrbFixedCtslΔTEC; n = 3 for TcrbFixedCtslΔTEC versus TcrbFixedCtslΔTEC). f, Scatter plot of the mean frequency of ‘recurrent’ TCRs in the TcrbFixedCtsl+/+ versus TcrbFixedCtslΔTEC repertoire as in c. Recurrent TCRs (n = 9,626) were defined as clonotypes found in three or more of all six samples regardless of genotype. TCRs exclusively found in Ctsl+/+ samples are highlighted in blue (CTSL-dependent TCRs; n = 3,848), and TCRs exclusively found CtslΔTEC samples are highlighted in red (‘newcomer TCRs’; n = 1,013); ND, not detected. g, Shannon diversity analysis (mean ± s.e.m.) of the CTSL-dependent (blue in f) or CTSL-independent (gray in f) subrepertoires within the TcrbFixedCtsl+/+ repertoire. P values in a, b, d and g were determined by Student’s two-tailed t-test and in e by one-way ANOVA with a Tukey’s test for multiple comparisons.
Source data
CTSL deficiency blunts CD4+ T cell responses
Having identified ‘clonal holes’ with various TCR transgenes and in the TcrbFixed repertoire, we asked whether CTSL deficiency caused corresponding ‘antigenic holes’ in a fully polyclonal setting. MHCII tetramer (Tet) staining revealed a marked reduction (or near absence) of cells recognizing the epitopes 2W, human invariant chain residues 277–285 (huCLIP) and PLP11–19 in CtslΔTEC mice (Fig. 4a,b). However, numbers of LLO190–201:I-Ab-specific CD4+ T cells were comparable between CtslΔTEC and Ctsl+/+ mice, both among peripheral CD4+ T cells and thymic CD4SP cells (Fig. 4c and Extended Data Fig. 4). Given the approximately fourfold reduction in total CD4+ T cell counts in CtslΔTEC mice (Extended Data Fig. 1e), the frequency of LLO-specific cells was thus even increased by a corresponding factor. To assess the functionality of these cells, we immunized mice with LLO peptide in adjuvant. At day 7 after challenge, ~1 × 10⁴ LLO-Tet+ T cells were detectable in the draining lymph nodes of Ctsl+/+ mice (Fig. 4d), reflecting a >20-fold expansion following antigen exposure. By contrast, despite higher precursor frequencies, LLO-Tet+ cells were approximately tenfold less abundant in CtslΔTEC mice (Fig. 4d).
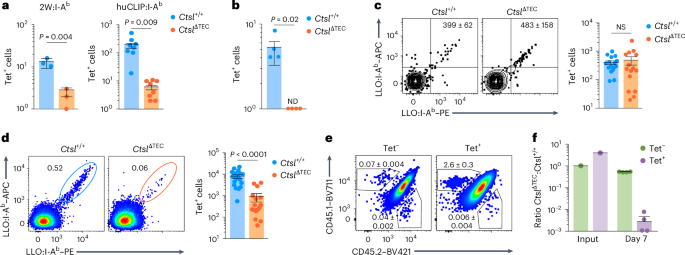
a, Total number ± s.e.m. of 2W- or huCLIP-specific CD4+ T cells in the naive repertoire of Ctsl+/+ (n = 3 for 2W; n = 8 for huCLIP) and CtslΔTEC mice (n = 3 for 2W; n = 8 for huCLIP), quantified by flow cytometric analysis after magnetic enrichment from pooled spleen and lymph node (LN) cells using 2W:I-Ab and huCLIP:I-Ab Tets, respectively. b, Total number ± s.e.m. of PLP11–19-specific CD4+ T cells in the naive repertoire of Ctsl+/+Plp1−/− (n = 4) and CtslΔTECPlp1−/− mice (n = 4), quantified as in a using a PLP11–19:I-Ab Tet. c, Representative flow cytometry plots of LLO190–201-specific CD4+ T cells gated on CD11b–CD11c–B220–F4/80–CD4+ T cells after magnetic enrichment from pooled spleen and lymph node cells using the LLO Tet and total number ± s.e.m. of LLO-Tet+ cells quantified as in a in the naive repertoire of Ctsl+/+ (n = 16) and CtslΔTEC mice (n = 15). d, Representative flow cytometry plots gated on activated CD11b–CD11c–B220–F4/80–CD44+CD4+ T cells without magnetic enrichment and total number ± s.e.m. of LLO190–201-specific CD4+ T cells in pooled spleen and lymph node cells of Ctsl+/+ (n = 19) and CtslΔTEC mice (n = 16) at day 7 after subcutaneous peptide immunization with adjuvant. e, Representative flow cytometry plot of CD45.1 versus CD45.2 on LLO-Tet– and LLO-Tet⁺ spleen cells in CD45.1/CD45.2 wild-type recipients (n = 4) of a 1:1 mixture of bulk M2 SP cells from CD45.1 Ctsl+/+ and CD45.2 CtslΔTEC donors at day 7 after i.v. challenge with LLO peptide plus poly(I:C) pregated on activated CD11b–CD11c–B220–F4/80–CD44+CD4+ T cells as in d. f, Ratio between CD45.2+CtslΔTEC and CD45.1+Ctsl+/+ donor-derived cells among LLO-Tet– and LLO-Tet⁺ in the input population (same 1:1 M2 CD4SP cell suspension administered to n = 4 recipient mice) and at day 7 after immunization (mean ± s.e.m.), as in e. Data in e and f are representative of two experiments. P values in a–d were determined by Student’s two-tailed t-test.
Source data
We performed adoptive co-transfer experiments to determine whether the diminished expansion of LLO-Tet+ cells in CtslΔTEC mice reflected a cell-intrinsic defect or an indirect consequence of lymphopenia. Bulk M2 thymocytes from CD45.2 CtslΔTEC and CD45.1 Ctsl+/+ donors were co-transferred at a 1:1 ratio (thereby establishing a ~4:1 ratio of CtslΔTEC to Ctsl+/+ LLO-Tet+ cells in the input population) into CD45.1/CD45.2 Ctsl+/+ recipients that had been intravenously (i.v.) immunized with LLO peptide plus polyinosinic–polycytidylic acid (poly(I:C)) 6 h before. At day 7 after challenge, Ctsl+/+CD45.1+ donor-derived cells accounted for 2.6 ± 0.3% of splenic LLO-Tet+ cells, whereas CtslΔTECCD45.2+ donor-derived cells contributed only marginally (0.006 ± 0.004%; Fig. 4e). This corresponded to a ratio of CtslΔTEC to Ctsl+/+ LLO-Tet+ cells of ~1:400 (Fig. 4f), indicating a marked competitive disadvantage in antigen-driven expansion and/or defective homeostatic maintenance of cells selected in CtslΔTEC donors. Thus, positive selection in CtslΔTEC mice not only created ‘antigenic gaps’ but also resulted in impaired expansion and/or persistence of retained cells following antigen encounter.
Nonselection affects clones across the CD5 range
Polyclonal ‘natural’ CD5hi clones have been reported to respond more robustly to immunization than CD5lo clones8, suggesting a direct link between the modalities of positive selection and responsiveness to foreign antigens3,8. To assess whether the nonselection of CTSL-dependent clones in the CtslΔTEC thymus correlated with their CD5 level, we generated TCR inventories from sorted TcrbFixedCtsl+/+ CD4SP cells at both extremes of the CD5 spectrum (Fig. 5a). The TCR compositions were remarkably stereotypic within the four replicates of CD5lo or CD5hi CD4SP cells, respectively, yet highly distinct between the two groups, as evidenced by Morisita–Horn comparisons (Fig. 5b). This supports the notion that partitioning of a given clone into the CD5lo or CD5hi subset of the CD4+ T cell compartment is not stochastic but specified by TCR identity. We classified TCRs found in three or more of four CD5lo samples and absent from all four CD5hi datasets as ‘natural CD5lo TCRs’ and those exhibiting a reciprocal pattern as ‘natural CD5hi TCRs’. Cross-comparison with the recurrent TCRs in our previously established TcrbFixedCtsl+/+ versus TcrbFixedCtslΔTEC datasets revealed that 70% of the natural CD5lo TCR clones and 43.5% of the natural CD5hi TCR clones were not selected in the absence of CTSL compared to a loss of 44.7% across all TCRs (Fig. 5c). Thus, at the global repertoire level, nonselection in the absence of CTSL was more pronounced among the natural CD5lo subrepertoire, yet affected clones across the entire spectrum of natural CD5 expression.
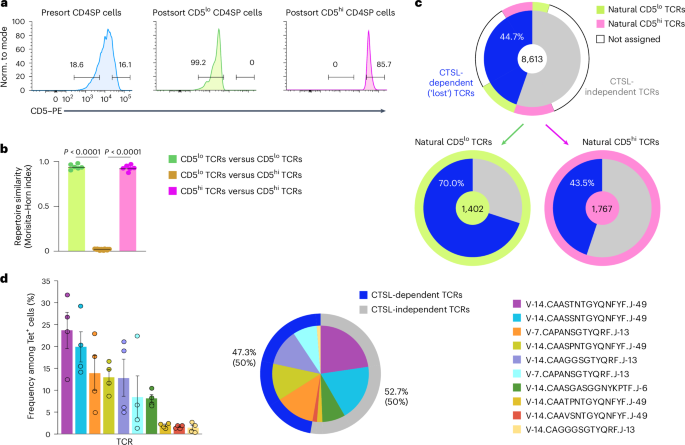
a, Representative flow cytometry plot of CD5 expression on total presort M2 CD4SP cells, postsort ‘natural’ CD5lo cells and postsort CD5hi cells from TcrbFixedCtsl+/+ mice, with sorting gates marking ~15% of cells at the low and high extremes of the CD5 spectrum. Histograms of postsort CD5lo and CD5hi cells show before bulk Tcra sequencing (n = 4 each). b, Subrepertoire similarity comparison by Morisita–Horn index (mean ± s.e.m.) for all pairwise comparisons between Tcra datasets from CD5lo and CD5hi M2 CD4SP cells as in a (n = 6 for CD5lo versus CD5lo; n = 16 for CD5lo versus CD5hi; n = 6 for CD5hi versus CD5hi). c, Pie charts showing the proportion of CTSL-dependent and CTSL-independent TCRs among 8,613 recurrent TCRs in the TcrbFixedCtsl+/+ CD4SP repertoire (top) and among 1,402 natural CD5lo TCRs (bottom left) and 1,767 natural CD5hi TCRs (bottom right). Top, colored segments in the outer ring indicate the subset of TCRs cross-assigned to the natural CD5lo or natural CD5hi subrepertoires. d, Relative percentages ± s.e.m. of the ten most abundant clonotypes among expanded LLO-Tet+CD4+ T cells sorted from the spleens of TcrbFixedCtsl+/+ mice at day 7 after i.v. challenge with LLO peptide plus poly(I:C), as quantified by bulk Tcra sequencing (n = 4) (left). The pie chart shows the relative contribution of the ten most abundant clonotypes among expanded LLO-Tet+CD4+ T cells in LLO-immunized TcrbFixedCtsl+/+ mice (middle). Colored segments in the outer ring indicate cross-assignment of these clones to CTSL-dependent and CTSL-independent TCRs among recurrent TCRs in the TcrbFixedCtsl+/+ CD4SP repertoire. Percentages indicate the proportion of Tcra reads (top) or clones (bottom, in parentheses). P values in b were determined by one-way ANOVA with a Tukey’s test for multiple comparisons.
Source data
We next assessed whether the diminished LLO-specific response in CtslΔTEC mice reflected a CTSL dependency of ‘good-responder’ TCR clones within the ‘normal’ repertoire. To this end, we i.v. immunized TcrbFixedCtsl+/+ mice with LLO and performed Tcra sequencing on the expanded LLO-Tet+ population at day 7 after challenge, identifying the top ten expanded clonotypes (Fig. 5d). These clonotypes were cross-referenced with our previously established inventories of CTSL-dependent and CTSL-independent TCRs in the naive repertoire of TcrbFixedCtsl+/+ mice, revealing that five TCRs could be assigned to the CTSL-dependent category and five to the CTSL-independent category (Fig. 5d). Thus, a significant proportion of ‘good-responder’ TCRs were retained in the CtslΔTEC repertoire, suggesting that the blunted response of LLO-Tet+ cells in CtslΔTEC mice could not be explained solely by the physical absence of all such clones.
CTSL specifies selection signals in CTSL-independent clones
To assess whether and which LLO-Tet+ clonotypes were retained in the absence of CTSL in a fully TCRαβ polyclonal setting, we performed single-cell TCR sequencing of LLO-Tet+ cells sorted from Ctsl+/+ and CtslΔTEC mice, yielding 316 and 156 paired TCRαβ clonotypes, respectively (Fig. 6a). Most of these were detected only once within each genotype; however, five TCRs were shared between Ctsl+/+ and CtslΔTEC mice (Fig. 6a). To explore the characteristics of such CTSL-independent CD4+ T cell clones, we generated two TCR transgenic mouse lines, hereafter Lm54Tg and Lm6Tg. Lm54Tg or Lm6Tg mice gave rise to CD4SP cells on both the Rag1−/−Ctsl+/+ and Rag1−/−CtslΔTEC backgrounds (Fig. 6b,c). However, CD4SP cells were reduced for both TCRs on the CtslΔTEC background (markedly for Lm6 cells and subtly for Lm54 cells; Fig. 6b,c and Extended Data Fig. 5a,b), with a corresponding reduction in peripheral CD4+ T cell numbers (Fig. 6d,e), indicating a graded impairment in positive selection in the absence of CTSL, even for these apparently CTSL-independent TCRs.
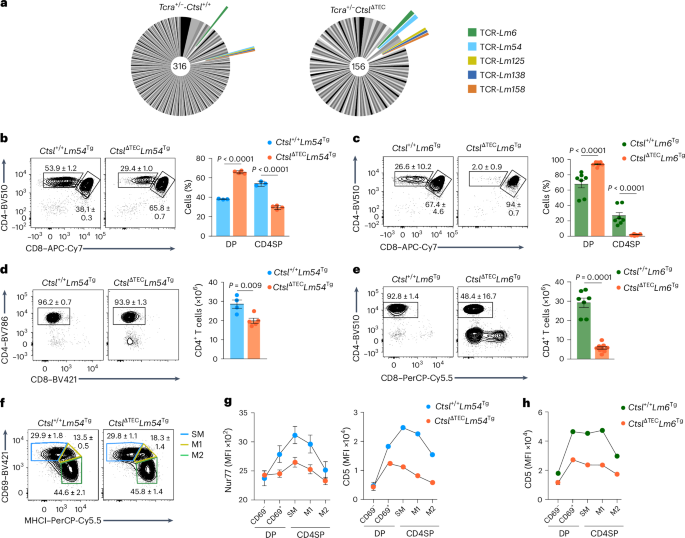
a, Pie charts representing LLO-specific clonotypes in the fully polyclonal repertoire of Tcra+/−Ctsl+/+ mice (n = 316 TCRs) and Tcra+/−CtslΔTEC mice (n = 156 TCRs), identified by single-cell Tcra and Tcrb sequencing of sorted LLO-Tet+ cells (n ≥ 42 mice per genotype; clonotypes aggregated across 19 experiments). Segments in shades of gray represent TCRs exclusively found in one genotype; colored segments represent ‘public’ TCRs shared between genotypes. Segment size is proportional to the number of mice in which a given TCR was detected. b, Representative flow cytometry plots and percent ± s.e.m. of thymocyte subsets in Ctsl+/+Lm54Tg (n = 3) and CtslΔTECLm54Tg mice (n = 4; hereafter CtslΔTECLm54Tg and Ctsl+/+Lm54Tg, respectively). c, Representative flow cytometry plots and percent ± s.e.m. of thymocyte subsets in Rag1−/−Ctsl+/+Lm6Tg (n = 7) and Rag1−/−CtslΔTECLm6Tg mice (n = 9; hereafter CtslΔTECLm6Tg and Ctsl+/+Lm6Tg, respectively). d, Representative flow cytometry plots and number ± s.e.m. of lymph node CD4+ T cells in Ctsl+/+Lm54Tg (n = 4) and CtslΔTECLm54Tg mice (n = 5). e, Representative flow cytometry plots and number ± s.e.m. of lymph node CD4+ T cells in Ctsl+/+Lm6Tg (n = 7) and CtslΔTECLm6Tg mice (n = 9). f, Representative flow cytometry plots of MHCI and CD69 surface expression on CD4SP cells from Ctsl+/+Lm54Tg (n = 9) and CtslΔTECLm54Tg mice (n = 10). The percent ± s.e.m. of SM, M1 and M2 cells is indicated. g, Nur77 and surface CD5 expression (MFI ± s.e.m.) at consecutive DP and CD4SP stages of differentiation in Ctsl+/+Lm54Tg (n = 4 or 5) and CtslΔTECLm54Tg (n = 4 or 5) mice, assessed by intracellular staining and flow cytometry (Nur77) or flow cytometry (CD5). h, CD5 surface expression (MFI ± s.e.m.) at consecutive DP and CD4SP cell differentiation stages in Ctsl+/+Lm6Tg (n = 4) and CtslΔTECLm6Tg mice (n = 5), as assessed by flow cytometry. P values in b and c were determined by two-way ANOVA and a Sidak’s test for multiple comparisons. Data in d and e were analyzed by Student’s two-tailed t-test.
Source data
Although CD4SP cells were reduced in Rag1−/−CtslΔTECLm54Tg mice compared to Rag1−/−Ctsl+/+Lm54Tg mice (hereafter CtslΔTECLm54Tg and Ctsl+/+Lm54Tg, respectively), their segregation into the SM, M1 and M2 subsets was virtually identical (Fig. 6f). To determine whether selection of Lm54 thymocytes in the presence or absence of CTSL affected the underlying TCR signals (despite seemingly identical developmental progression downstream of the positive selection checkpoint), we assessed the expression of the nuclear receptor Nur77, whose levels reflect ongoing or recent TCR signaling29. Although Lm54 thymocytes in Ctsl+/+ mice showed typical dynamic Nur77 modulation, with upregulation in the signaled DP cells and return to baseline in M2 CD4SP cells, Nur77 expression was markedly attenuated in cells selected in CtslΔTEC mice (Fig. 6g), consistent with weaker selecting TCR–pMHC interactions in the absence of CTSL. In line with this, both Lm54 and Lm6 thymocytes selected in CtslΔTEC mice showed markedly lower CD5 upregulation than their counterparts selected in Ctsl+/+ mice (Fig. 6g,h), and this pattern was also observed for CD6, whose expression likewise correlates with TCR signal strength30 (Extended Data Fig. 5c). Thus, even for TCR clones that appeared CTSL independent in their repertoire seeding, CTSL was still crucial for calibrating the intensity of the positive selection signal.
Functional tuning by CTSL regulates homeostatic fitness
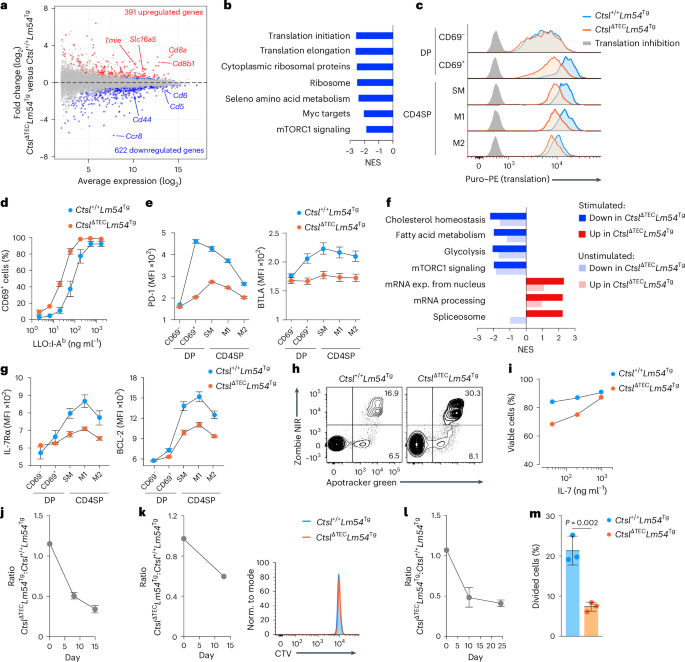
We next compared gene expression profiles in M2 CD4SP cells from CtslΔTECLm54Tg and Ctsl+/+Lm54Tg mice. Genes more highly expressed in CtslΔTEC cells included the genes encoding the two subunits of co-receptor CD8, as well as ion channels or solute carriers such as TMIE and SLC16A5 (Fig. 7a), which typically peak in DP cells, whereas Ccr8, which is upregulated in CD4SP cells31, was reduced, consistent with ‘less mature’ traits in thymocytes selected in the absence of CTSL. Gene set enrichment analysis (GSEA) further revealed underrepresented transcripts in CtslΔTEC cells linked to translation, mTORC1 signaling and Myc targets (Fig. 7b), and these correlated with reduced cell size and diminished upregulation of CD44, a marker of mTOR signaling32,33 (Extended Data Fig. 6a,b), suggesting reduced metabolic activity. Consistent with this, ex vivo assessment of basal protein biosynthesis showed diminished translation in the absence of CTSL, first emerging in CD69+ signaled DP cells and persisting through the M2 CD4SP cell stage (Fig. 7c).
a, MA plot of gene expression in Ctsl+/+Lm54Tg (n = 4) versus CtslΔTECLm54Tg (n = 5) M2 CD4SP cells; differentially expressed genes (adjusted P value of b, GSEA showing gene sets underrepresented (normalized enrichment score (NES) CtslΔTECLm54Tg cells as in a. c, Representative flow cytometry plots showing translation at thymocyte stages in Ctsl+/+Lm54Tg and CtslΔTECLm54Tg mice (n = 3 each). A translation inhibitor (background) was included. d, CD69 expression (MFI ± s.e.m.) in M2 CD4SP cells from Ctsl+/+Lm54Tg and CtslΔTECLm54Tg mice (n = 4 each) after 18 h of stimulation with plate-bound LLO190–201:I-Ab. e, PD-1 and BTLA expression (MFI ± s.e.m.) at consecutive DP and CD4SP stages of differentiation in Ctsl+/+Lm54Tg (n = 3) and CtslΔTECLm54Tg mice (n = 4), as assessed by flow cytometry. f, GSEA of Ctsl+/+Lm54Tg versus CtslΔTECLm54Tg M2 CD4SP cells (n = 2 each) after 4 h of stimulation as in d or unstimulated as in a; only gene sets with a normalized enrichment score (NES) of >| 2 | in stimulated cells are shown. g, IL-7Rα and BCL-2 expression (MFI ± s.e.m.) at consecutive DP and CD4SP stages of differentiation in Ctsl+/+Lm54Tg and CtslΔTECLm54Tg mice (n = 5 each). Samples were analyzed by flow cytometry. h, Representative flow cytometry plots showing apoptosis in Ctsl+/+Lm54Tg and CtslΔTECLm54Tg M2 CD4SP cells (n = 5 each) after 24 h of culture in normal medium. i, Viability (mean ± s.e.m.) of Ctsl+/+Lm54Tg and CtslΔTECLm54Tg M2 CD4SP cells (n = 3 each) after 24 h of culture with IL-7, as assessed by flow cytometry. j, Donor cell ratio ± s.e.m. in the spleens of 4.5-Gy-irradiated recipients (n = 4) after transfer of a 1:1 mixture of Ctsl+/+Lm54Tg and CtslΔTECLm54Tg M2 CD4SP cells, as assessed by flow cytometry. k, Ratio ± s.e.m. of donor cells in the spleens of MHCII−/− recipients (n = 3) after transfer of a 1:1 mixture of CellTrace Violet (CTV)-labeled Ctsl+/+Lm54Tg and CtslΔTECLm54Tg M2 CD4SP cells. Histogram (right) shows representative CTV profiles on day 13 after transfer. l, Ratio ± s.e.m. of donor cells in the blood of Rag1−/− recipients (n = 4) after transfer of a 1:1 mixture of Ctsl+/+Lm54Tg and CtslΔTECLm54Tg M2 CD4SP cells. m, Percent divided cells ± s.e.m. in an experimental replicate as in l with CellTrace Violet-labeled donor cells (n = 3 Rag1−/− recipients; day 9). Data were analyzed by Student’s two-tailed t-test.
Source data
After 18 h of stimulation with plate-bound I-Ab:LLO190–201 in vitro, M2 CD4SP cells from CtslΔTECLm54Tg mice upregulated the activation marker CD69 with an approximately fivefold lower half-maximum inhibitory concentration than their counterparts from Ctsl+/+Lm54Tg mice (Fig. 7d), indicating enhanced TCR sensitivity. Elevated responsiveness to TCR stimulation was likewise observed in polyclonal CtslΔTEC M2 CD4SP cells (Extended Data Fig. 6c). By contrast, short-term stimulation with phorbol 12-myristate 13-acetate (PMA), which bypasses upstream TCR signaling, elicited comparable levels of ERK phosphorylation in M2 CD4SP cells selected in CtslΔTECLm54Tg and Ctsl+/+Lm54Tg mice (Extended Data Fig. 6d), suggesting that the hyperresponsiveness of CD4SP cells selected in the absence of CTSL was confined to the proximal TCR signaling cascade. Flow cytometric analysis showed that, in addition to CD5 and CD6, two further negative regulators of TCR signaling (PD-1 and BTLA34,35) also exhibited reduced expression downstream of positive selection in CtslΔTECLm54Tg mice compared to Ctsl+/+Lm54Tg mice (Fig. 7e). These findings suggest that the observed TCR-proximal hyperresponsiveness of cells selected in the absence of CTSL may be attributable to reduced expression of multiple TCR signaling attenuators.
Gene expression profiling of M2 CD4SP cells from CtslΔTECLm54Tg or Ctsl+/+Lm54Tg mice after stimulation with plate-bound I-Ab:LLO190–201 revealed a relative enrichment of transcriptional modules related to mRNA export, processing and splicing (processes potentially more directly linked to TCR activation) in cells selected in the absence of CTSL (Fig. 7f). By contrast, these cells exhibited comparably less efficient implementation of transcriptional programs related to key metabolic pathways crucial for sustaining T cell activation, including proliferation, glycolysis, mTORC1 signaling, cholesterol homeostasis and fatty acid metabolism (Fig. 7f). Many of these differences were not exclusively triggered following TCR activation but were already evident before stimulation and became more pronounced following TCR engagement (Fig. 7f), suggesting that these traits had been differentially ‘imprinted’ during positive selection in the presence or absence of CTSL.
Given the aberrant ‘tuning’ of multiple basal metabolic programs when Lm54 CD4+ T cells were selected in the absence of CTSL, we next examined additional hallmarks associated with CD4+ T cell survivability. Flow cytometric analysis showed that, across all maturation stages downstream of positive selection, expression of the interleukin-7 receptor (IL-7R) and BCL-2 (both key orchestrators of CD4+ T cell survival36) was reduced in CtslΔTECLm54Tg mice compared to Ctsl+/+Lm54Tg mice (Fig. 7g).
We therefore next assessed whether M2 CD4SP cells from these two genotypes differed in their homeostatic properties. Following 24-h in vitro culture without added growth factors or TCR stimulation, cells selected in the absence of CTSL exhibited substantially higher apoptosis (Fig. 7h). Administration of high-dose IL-7 rescued this in vitro survival defect (Fig. 7i). To address whether selection in the absence of CTSL impaired homeostasis in vivo, we conducted competitive co-transfer experiments using M2 CD4SP cells from CtslΔTECLm54Tg and Ctsl+/+Lm54Tg mice. Two weeks after co-transfer at a 1:1 ratio into sublethally irradiated wild-type recipients, the donor cell ratio had markedly shifted in disfavor of cells selected in the absence of CTSL (Fig. 7j). Analogous co-transfers of polyclonal M2 CD4SP cells from CtslΔTEC and Ctsl+/+ donors to wild-type recipients recapitulated these observations and revealed a tendency toward diminished homeostatic proliferation of CtslΔTEC cells (Extended Data Fig. 6e,f).
To disentangle the complex interplay between tonic TCR–pMHCII interactions and competition for soluble cues such as IL-7, which together sustain naive CD4+ T cell maintenance and may also drive homeostatic proliferation36, we repeated the co-transfer of M2 CD4SP cells from CtslΔTECLm54Tg and Ctsl+/+Lm54Tg mice using MHCII−/− or Rag1−/− recipients. In MHCII−/− hosts (where homeostatic MHCII contacts are abolished but survival factors such as IL-7 are readily available due to the absence of endogenous CD4+ T cells), cells selected in the absence of CTSL again exhibited a competitive disadvantage, although neither donor population showed evidence of proliferation (Fig. 7k). This indicated a diminished survivability of cells selected in the absence of CTSL that was not explained by altered responsiveness to tonic TCR signaling and/or reduced homeostatic proliferation. In Rag1−/− recipients, which similarly provide ample access to soluble survival factors owing to their lack of an endogenous CD4+ T cell compartment but, in contrast to MHCII−/− recipients, permit homeostatic TCR–pMHCII contacts, the donor cell ratio once more shifted in disfavor of cells selected in the absence of CTSL (Fig. 7l). However, unlike in MHCII−/− recipients (Fig. 7k), a significantly smaller proportion of these cells underwent at least one cell division (Fig. 7m), revealing defective homeostatic proliferation as an additional layer of impaired functional fitness. Thus, CD4+ T cells selected in CtslΔTEC mice in a seemingly CTSL-independent manner (based on their progression to the mature CD4SP stage) retained a lasting functional imprint of their selection history, manifesting as a metabolically less poised state and diminished homeostatic responsiveness to both ‘tonic’ TCR signals and TCR-independent survival cues.


